Feel free to download my CV.
Data visualization guidelines
Context
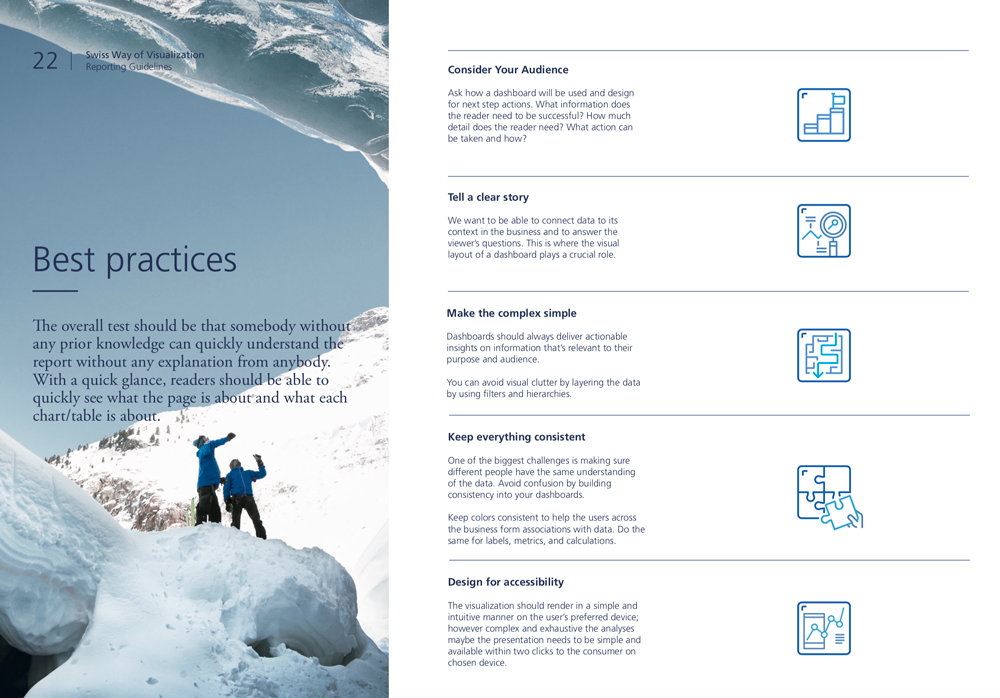
Visualization allows us to rapidly access huge amounts of data in easily digestible forms. From rationalising a choice of graph, to creating a clear hierarchy that streamlines drill-downs into data, effective visualization enhances user experience.
Business question
Can we obtain faster, clearer business insights, and data-driven solutions by improving and standardising data visualization across the corporation?
Customer
Zurich Insurance Group
Zürich, Switzerland
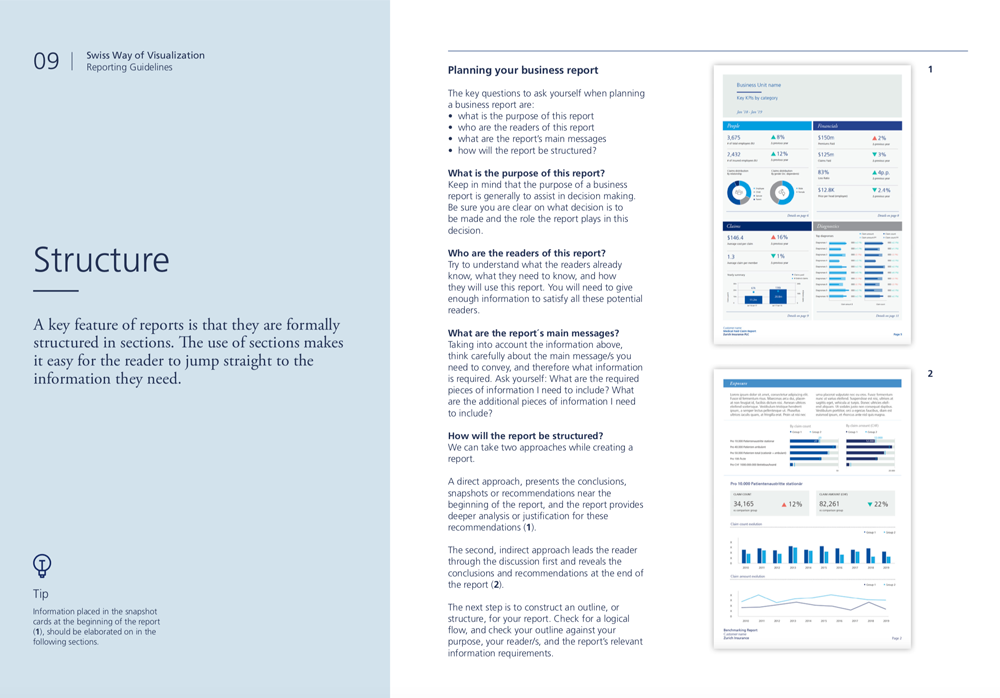
Where to start?
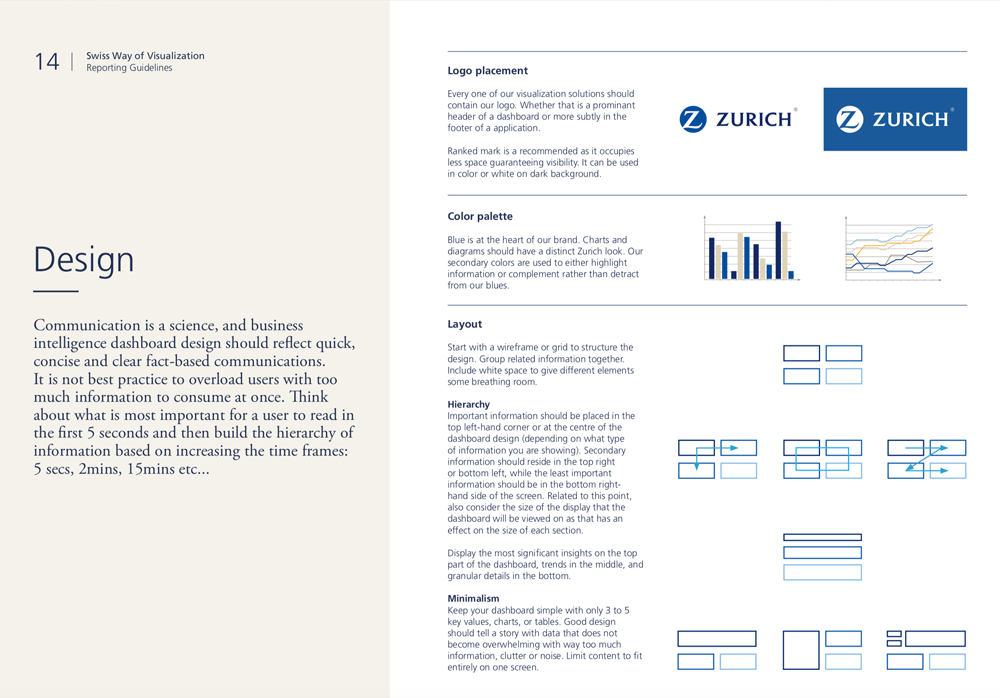
Creating a report starts before you build your first visual because a good report needs planning. Know what data you have to work with and write down the requirements for the report. Ask yourself “What is the business need, how is this data going to be used, and by whom? What decisions does the reader want to be able to make based on this report?” The answer to those questions will drive the design. Every report tells a story. Make sure that story matches the business goals.

Guidelines
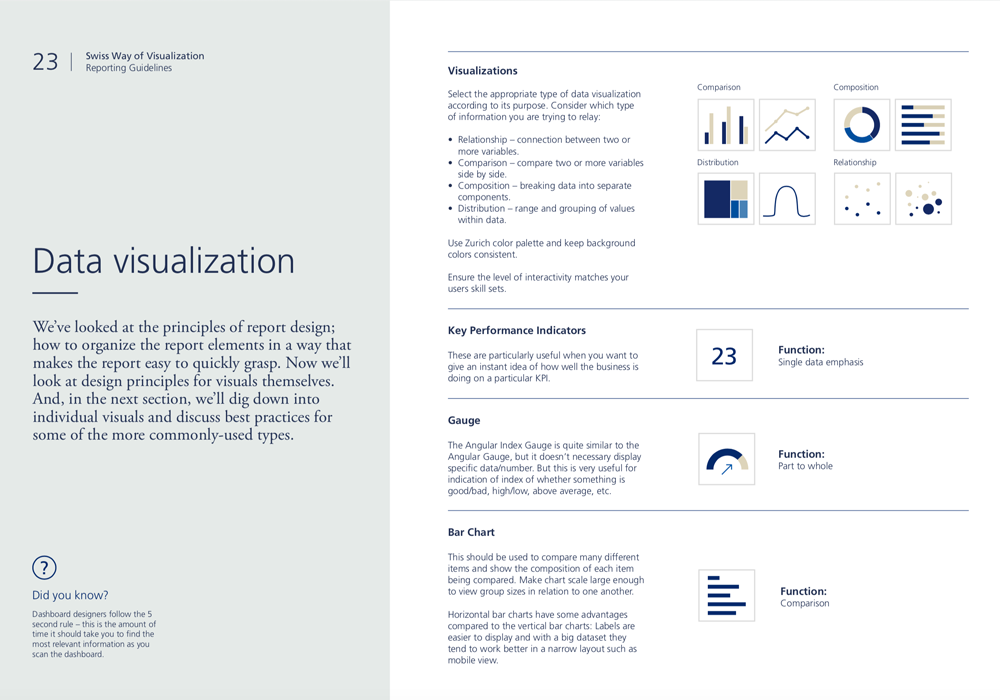
Why does data visualization matter now?
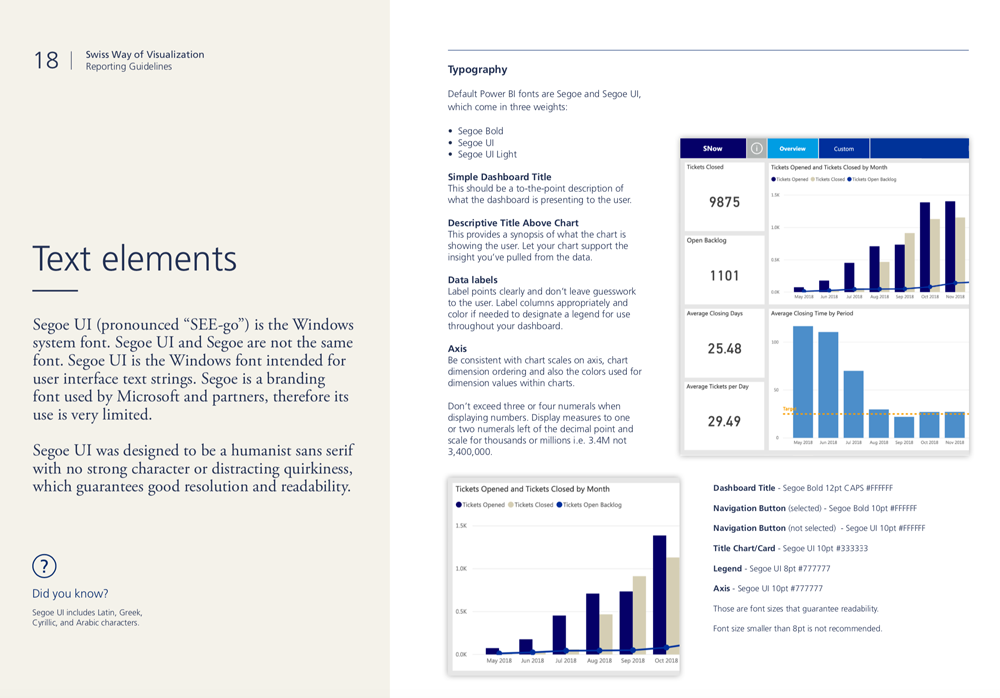
Human brain understands information drawn from pictures more easily than from written sentences, essays, spreadsheets etc. You must have seen traffic symbols while driving… why do they have only one picture instead of writing a whole sentence like 'school ahead', 'deer crossing' or 'narrow bridge'? Because you as a driver can grasp the image faster while keeping your eyes on the road.
Over the last 25 years, technology has given us readily available popular methods like line, bar, and pie charts showing company progress in different forms, which still dominate the boardrooms.
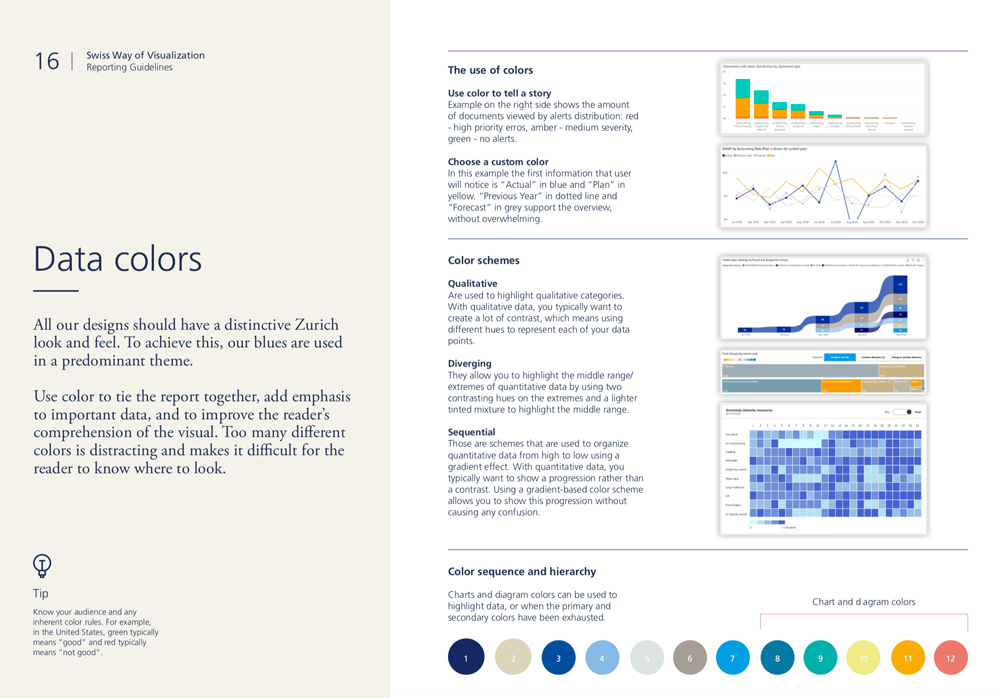
Data visualization has become a fundamental discipline as it enables more and more businesses and decision makers to see big data and analytics presented visually. It helps identify the exact area that needs attention or improvement, rather than leaving it to the leaders to interpret as they want.